Monitoring
The Monitor allows you to monitor a Variable in time.
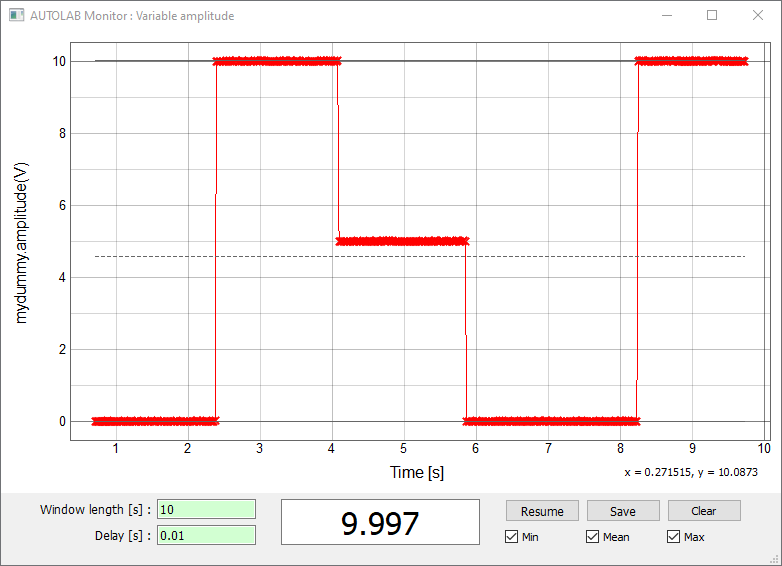
Monitoring panel
To start a monitoring, right click on the desired Variable in the control panel, and click Start monitoring. This Variable has to be readable (read function provided in the driver) and numerical (integer, float value or 1 to 3D array).
In the Monitoring window, you can set the Window length in seconds. Any points older than this value is removed. You can also set a Delay in seconds, which corresponds to a sleep delay between each measure.
You can pause the monitoring with the Pause button, and save the current graph and data with the Save button. You will be prompted to give a folder path where the data will be saved.
You can clear the displayed data with the Clear button.
You can display a bar showing the Min or Max value reached since the beginning of the monitoring. Use the Clear button to start back with new min and max value.
The Mean option display the mean value of the currently displayed data (not from the beginning).
The Pause on scan start checkbox allows to pause a monitor during a scan to prevent multiple communication with an instrument (prevent bug and speed up execution).
The start on scan end checkbox allows to start back the monitoring after a scan.
Thanks to the pyqtgraph package, it is possible to monitor images.
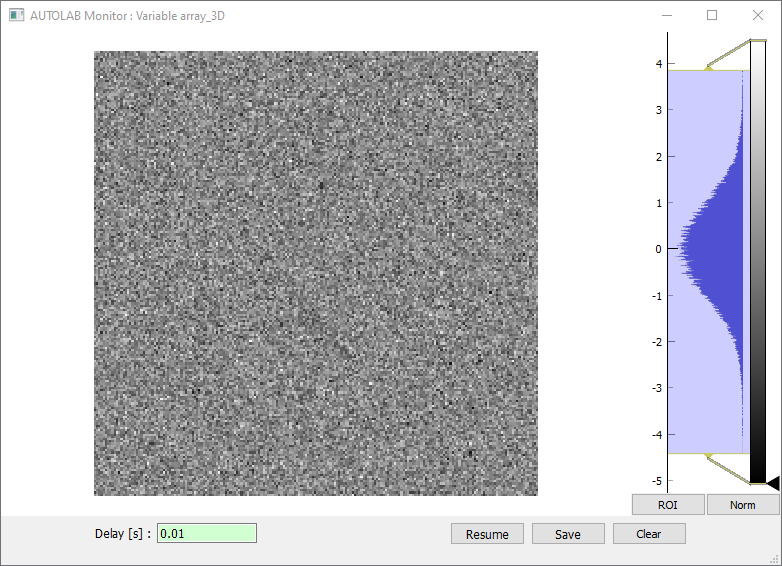
Monitoring images