Experimental features
Executing Python codes in GUI
A function for executing python code directly in the GUI can be used to change a variable based on other device variables or purely mathematical equations.
To use this function both in the control panel and in a scan recipe, use the special $eval: tag before defining your code in the corresponding edit box.
This name was chosen in reference to the python function eval used to perform the operation and also to be complex enough not to be used by mistake and produce an unexpected result.
The eval function only has access to all instantiated devices and to the pandas and numpy packages.
>>> # Usefull to set the value of a parameter to a step of a recipe
>>> $eval:system.parameter_buffer()

>>> # Useful to define a step according to a measured data
>>> $eval:laser.wavelength()

>>> # Useful to define a step according to an analyzed value
>>> $eval:plotter.bandwitdh.x_left()
>>> $eval:np.max(mydummy.array_1D())

>>> # Usefull to define a filename which changes during an analysis
>>> $eval:f"data_wavelength={laser.wavelength()}.txt"

>>> # Usefull to add a dataframe to a device variable (for example to add data using the action plotter.data.add_data)
>>> $eval:mydummy.array_1D()
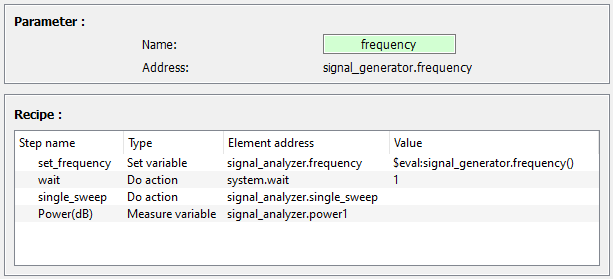
It can also be useful in a scan for example to set the central frequency of a spectral analyzer according to the frequency of a signal generator. Here is a example to realize this measurement using $eval:.

Logger
A logger can be added to the control center using the variable logger = True in the section [control_center] of autolab_config.ini.
It monitor every print functions coming from autolab GUI or drivers to keep track of bugs/errors.
It is inside a pyqtgraph docker, allowing to detached it from the control panel and place it somewhere visible.
Console
A Python console can be added to the control center using the variable console = True in the section [control_center] of autolab_config.ini.
It allows to inspect autolab or drivers while using the GUI for debugging purposes.
Plot from driver
When creating a plot from a driver inside the GUI usualy crashes Python because the created plot isn’t connected to the GUI thread. To avoid this issue, a driver can put gui=None as an argument and use the command gui.createWidget to ask the GUI to create the widget and send back the instance. This solution can be used to create and plot data in a custom widget while using the GUI.